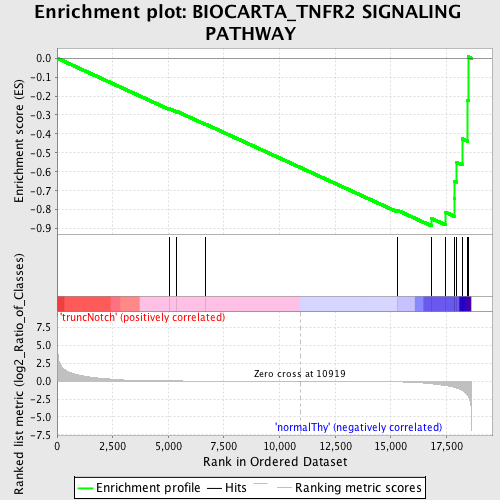
Profile of the Running ES Score & Positions of GeneSet Members on the Rank Ordered List
| Dataset | Set_03_truncNotch_versus_normalThy.phenotype_truncNotch_versus_normalThy.cls #truncNotch_versus_normalThy.phenotype_truncNotch_versus_normalThy.cls #truncNotch_versus_normalThy_repos |
| Phenotype | phenotype_truncNotch_versus_normalThy.cls#truncNotch_versus_normalThy_repos |
| Upregulated in class | normalThy |
| GeneSet | BIOCARTA_TNFR2 SIGNALING PATHWAY |
| Enrichment Score (ES) | -0.8860633 |
| Normalized Enrichment Score (NES) | -1.4988372 |
| Nominal p-value | 0.019438446 |
| FDR q-value | 0.39875928 |
| FWER p-Value | 0.997 |
| PROBE | DESCRIPTION (from dataset) | GENE SYMBOL | GENE_TITLE | RANK IN GENE LIST | RANK METRIC SCORE | RUNNING ES | CORE ENRICHMENT | |
|---|---|---|---|---|---|---|---|---|
| 1 | TNFRSF1B | 3990035 5860372 | 5055 | 0.040 | -0.2673 | No | ||
| 2 | TANK | 1090020 2060458 2370400 | 5384 | 0.034 | -0.2813 | No | ||
| 3 | RIPK1 | 3190025 | 6667 | 0.017 | -0.3483 | No | ||
| 4 | LTA | 1740088 | 15289 | -0.079 | -0.8031 | No | ||
| 5 | RELA | 3830075 | 16834 | -0.358 | -0.8470 | Yes | ||
| 6 | NFKBIA | 1570152 | 17455 | -0.610 | -0.8137 | Yes | ||
| 7 | TRAF2 | 5900148 | 17846 | -0.847 | -0.7424 | Yes | ||
| 8 | MAP3K14 | 5890435 | 17867 | -0.866 | -0.6490 | Yes | ||
| 9 | TRAF1 | 3440735 | 17963 | -0.948 | -0.5507 | Yes | ||
| 10 | TRAF3 | 5690647 | 18205 | -1.269 | -0.4253 | Yes | ||
| 11 | TNFAIP3 | 2900142 | 18460 | -1.987 | -0.2224 | Yes | ||
| 12 | MAP3K1 | 5360347 | 18485 | -2.116 | 0.0070 | Yes |

